- Software Gestor para Aquicultura
- Falar pelo WHATSAPP
- contato@despesca.com.br
10 Essential Production Metrics Every Shrimp and Fish Producer Must Monitor in Management Software

Automatic Feeders and Sensors
23/10/2025
10 Ways to Properly Manage Waste and Effluents in Your Production
06/11/2025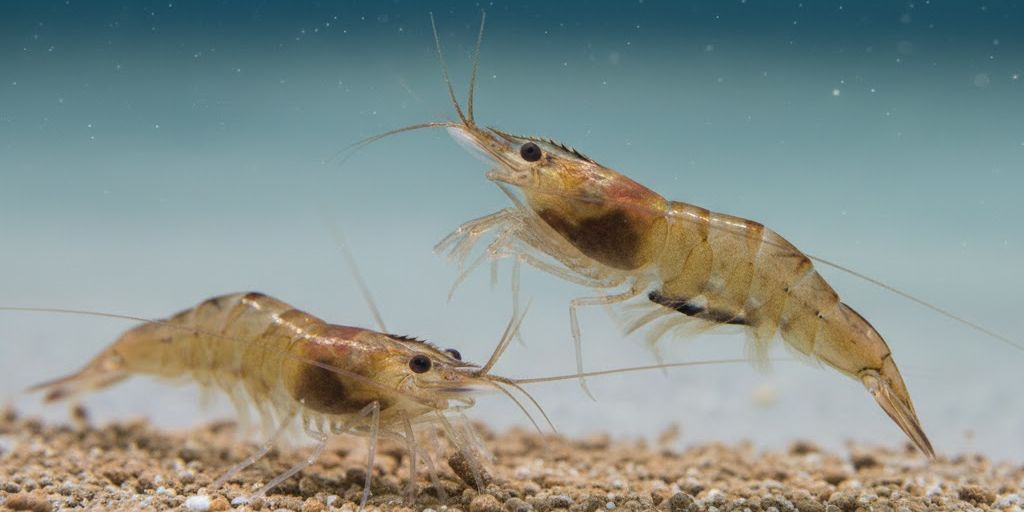
The adoption of precise production metrics has become a competitive advantage for shrimp and fish producers worldwide. With increasing demands for efficiency and sustainability, specialized management software transforms raw data into actionable insights. Consequently, understanding which indicators to prioritize is fundamental for reducing risks and maximizing results. Additionally, recent studies indicate that farms systematically monitoring these variables can increase productivity by up to 30% (Source: ABCCAM, 2024).
The Central Role of Production Metrics in Decision-Making
In modern aquaculture, data collection is no longer optional—it has become the foundation for strategic decisions. For instance, weekly variations in environmental parameters such as temperature, pH, and dissolved oxygen, when analyzed through software, enable real-time adjustments to feeding schedules. In this way, producers avoid waste and improve feed conversion. Moreover, as highlighted in our analysis on aquaculture data analysis, building reliable historical records is the first step toward predicting challenges and acting preventively.
10 Essential Production Metrics for Your Aquaculture Operation
1. Feed Conversion Ratio (FCR)
The FCR measures feeding efficiency by dividing the amount of feed provided by the weight gain of the animals. According to ABCCAM (2024), 29.3% of Ceará enterprises operate with FCR between 1.0 and 1.25, considered the ideal range. However, values above 1.5 indicate significant waste, often linked to feed quality, stocking density, or inadequate management. Throughout the production cycle, FCR should be monitored weekly, as seasonal variations—such as reduced availability of natural food in winter—directly impact its efficiency. Furthermore, a 0.1 reduction in FCR can represent substantial profit differences per hectare/year, especially in intensive systems. For mastering this metric, consult our guide on how to optimize FCR in shrimp farming.
2. Daily Shrimp Growth Curve
Monitoring daily growth allows identification of developmental delays before they become critical. Random biometrics do not provide precise comparisons, while continuous curves reveal hidden patterns. This metric is particularly relevant during the grow-out phase, where deviations of up to 10% from the expected curve signal nutritional problems or environmental stress. Additionally, by cross-referencing growth data with parameters like temperature and salinity, feeding strategies can be adjusted in real time.
3. Weekly Environmental Parameter Variations
Temperature, alkalinity, and salinity should be recorded weekly. Studies in Sergipe/Brazil (InterCiência, 2017) demonstrate that FCR in lowland areas varies between 3.49 (summer) and 5.54 (winter), while in highland areas it ranges from 2.95 to 5.0. This difference occurs due to greater availability of natural food in lower stocking density areas. Therefore, monitoring these parameters enables feed adjustments according to local conditions, preventing waste from under or overfeeding.
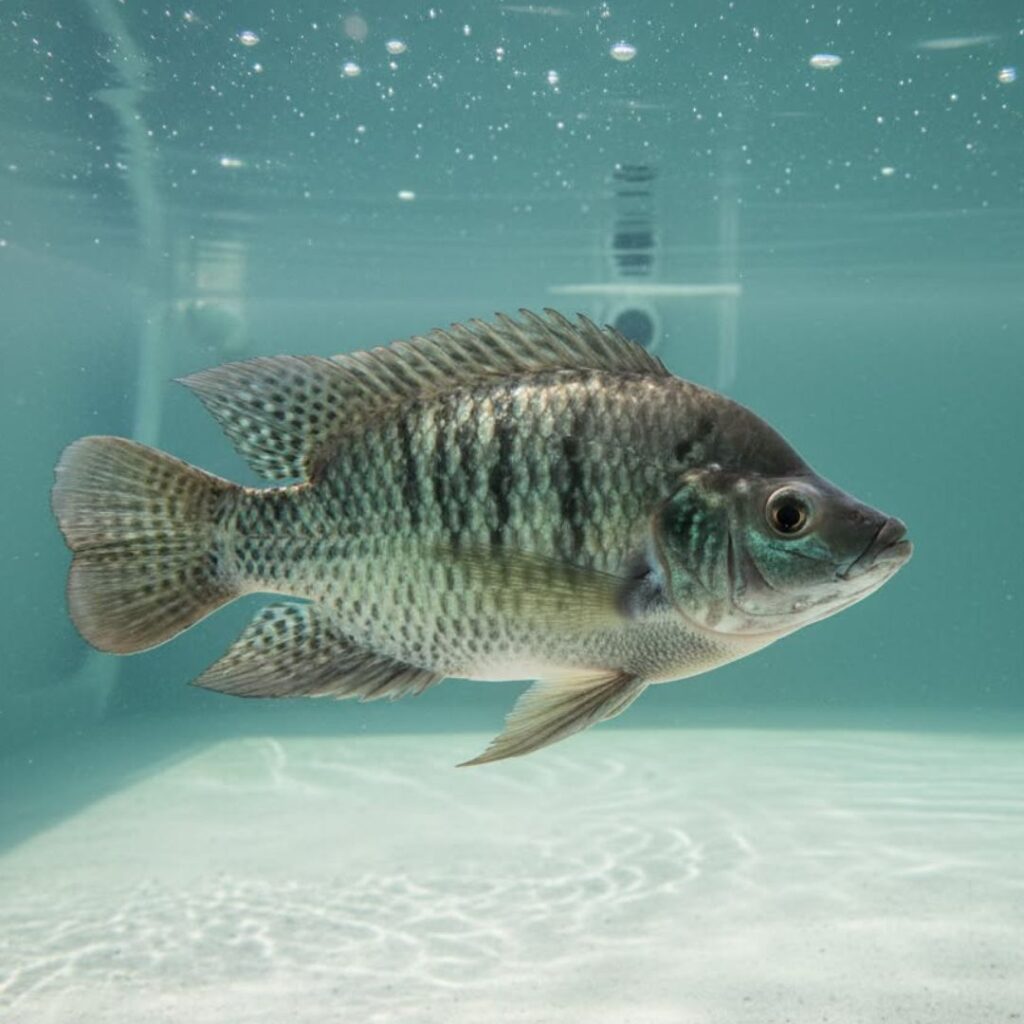
4. Post-Larval Survival Rate
A survival rate below 80% signals problems with post-larval quality or initial management. This metric is critical during the first 30 days, when factors such as water temperature and pond bottom quality drastically influence mortality. Conversely, rates above 90% indicate good stocking practices and environmental preparation, essential for maintaining ideal density throughout the entire cycle.
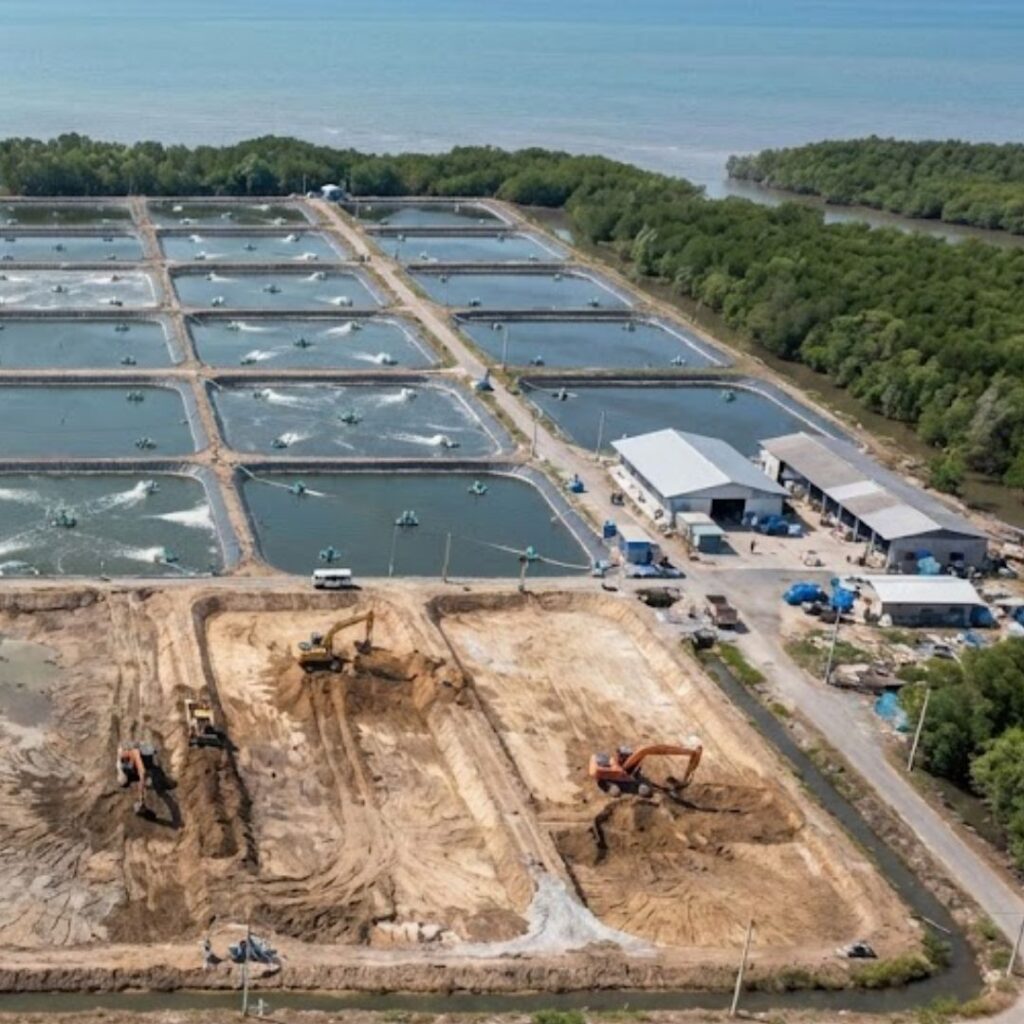
5. Productivity per Hectare (kg/ha/year)
Comparing your productivity against regional benchmarks is essential. While Ecuador achieves 2,304 kg/ha/year, Brazil’s average barely exceeds 2,567 kg/ha/year (ABCCAM, 2024 – Brazil). This metric reflects the integrated efficiency of all processes—from post-larval quality to environmental management. Moreover, consistent productivity above regional averages is a key indicator for attracting investments and sustainability certifications.
6. Daily Feeding Index
Calculate the relationship between feed offered and estimated biomass. Deviations exceeding 10% require immediate intervention, as they indicate overfeeding (causing water degradation) or underfeeding (reducing growth). This index should be adjusted according to development stage: in the initial phase, shrimp consume up to 15% of their body weight daily, while in the final phase, this rate drops to 3-5%.
7. Real-Time Water Quality
Sensors integrated with software alert about oxygen drops or critical pH levels, preventing mass mortality. Water quality is directly linked to FCR, as unconsumed feed degrades water quality, requiring higher correction costs. For example, ammonia levels above 0.5 mg/L reduce shrimp appetite, increasing FCR by up to 20%.
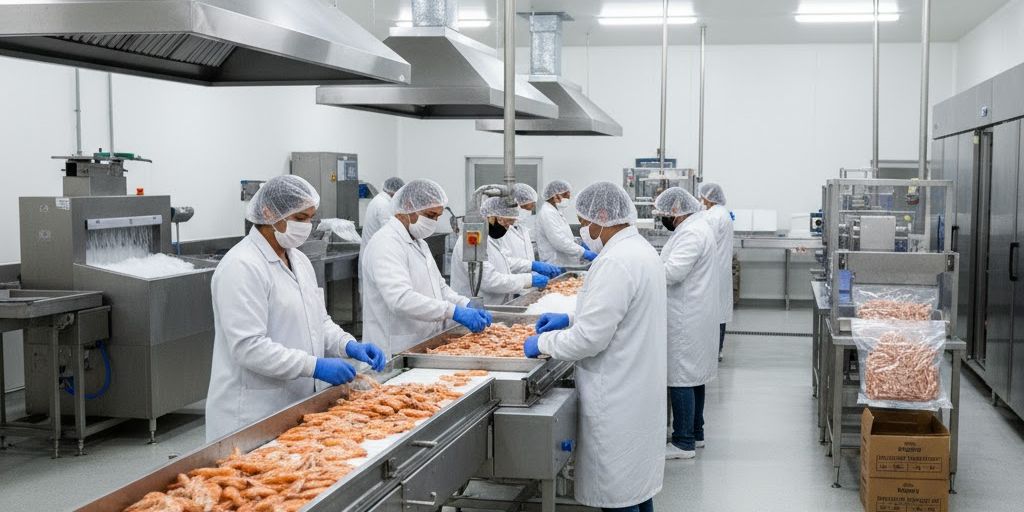
8. Operational Cost per Kilogram Produced
Include all inputs, labor, and energy. Producers with costs below $3.25/kg dominate the domestic market. This metric is vital for setting sale prices and identifying operational bottlenecks. For instance, a sudden increase in cost per kilogram may indicate problems with feed conversion or aerator system failures.
9. Specific Growth Rate (SGR)
Indicates the speed of weight gain. Values below 2.5% per day require nutritional review. SGR is calculated by the formula: [(ln Final Weight – ln Initial Weight) / Days] x 100. This metric helps identify developmental delays before they become irreversible, especially in super-intensive cultivation systems.
10. Aerator Efficiency
Monitor energy consumption versus oxygen generated. Poorly calibrated aerators can increase costs by 15%. According to Sebrae’s Basic Guide (Brazil) (2023), the ideal ratio is 1.5 kg O₂/kWh. Furthermore, aerator efficiency directly impacts water quality and consequently FCR and survival rates.
Conclusion: Production Metrics as a Sustainability Lever
The rigorous adoption of these production metrics not only increases profitability but also strengthens the producer’s image before demanding markets. Remember: each 0.1 reduction in FCR represents significant profit gains per hectare/year. Therefore, invest in technology and training—the future of aquaculture is data-driven.


